« 5.4: Dictionaries |
6.1: Image Formats »
External Data
You’ve already utilised external data in the form of images in your Processing sketches. Python – and by extension, Processing – can handle many additional file types. For instance, you could create a game using Processing that incorporates various audio and video files, storing these multimedia assets in your sketch’s “data” directory. For now, though, we’ll look at text-based files.
Processing is not that great for developing games. There are plenty of better options out there. LÖVE is a neat little 2D-engine programmed in a language called Lua. For something Python-based, you could try Pygame.
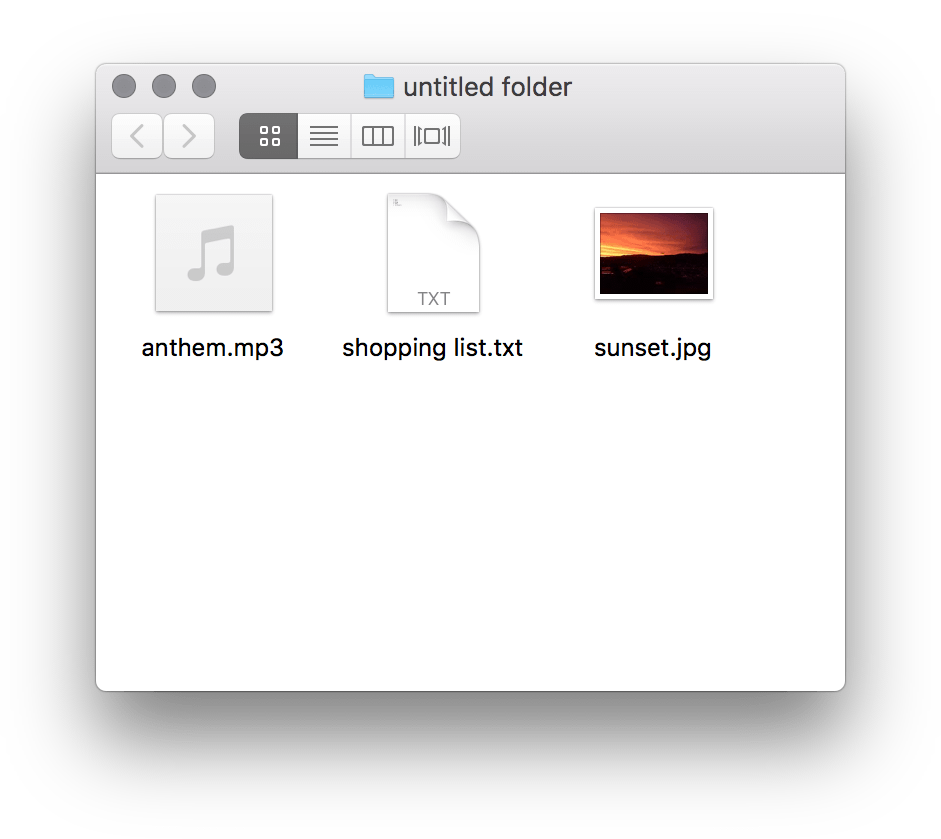
A file format is a standardised means of encoding information for storage on a digital medium. There are many such formats, each interpreted differently. For example, applications are encoded in executable formats, such as APK for Android or EXE for Windows. Then, there are multimedia formats, like MP3 for music or JPG for images. You can identify a file’s format by its file extension. Frustratingly, many operating systems hide file extensions – but, if you dig around in your Windows or Mac Finder settings, you can get them to show in your file manager. File extensions are (most commonly) three letters in length, always preceded by a full-stop/period, and tacked onto the end of a file name. In the screenshot below, the file manager reveals the extensions of three files: an audio (.mp3), plain text (.txt) and image (.jpg) file.
Your system relies on the file extensions to open files with an appropriate app, and also to generate icons. If you remove or rename a file extension, this association is lost. Perhaps you’ve tried to open an MP3 (or JPG) file in a text editor? If so, you’ll know that all you get is a bunch of garbled characters:
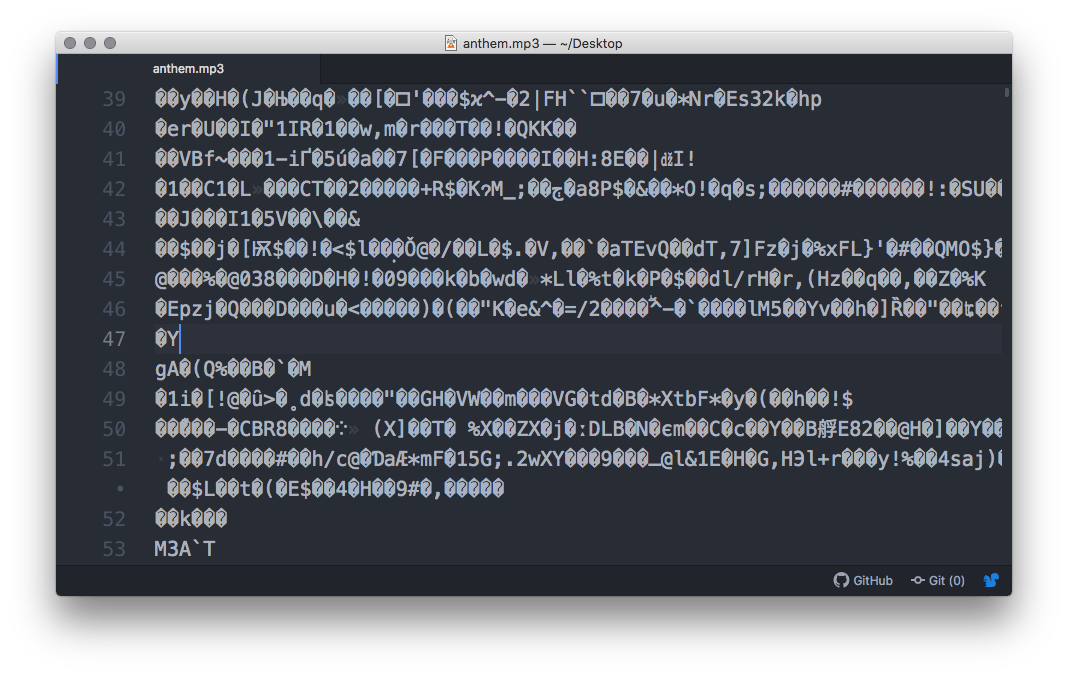
Atom is designed for editing text-encoded files, and therefore attempts to interpret the audio data as characters. While you might spot some intelligible metadata in there somewhere, it’s 99% gobbledygook. Yet, if you open this same file in iTunes, Windows Media Player, or VLC, you hear music.
Some file formats are text-based; this means that you can open them in any text or code editor (like Atom) and make some sense of the content. To clarify: by text-based, I mean plain text – as in, not a Word document. “Plain” means no bold, no italic, no varied fonts, etc. If you’ve written HTML before, you know what I’m talking about. So – you may be wondering – what is plain text good for? Well, shopping lists … and HTML, XML, CSV, JSON, and programming code, among other things. For instance, Processing files are plain text, albeit with a .pyde file extension.
Suppose that you wish to share a music playlist on your blog. For sharing playlists, many media players provide an ‘export to XML’ feature of some sort. XML (eXtensible Markup Language) files have a .xml extension. To give an idea of what VLC generates, here’s a snippet of XML code:
<?xml version="1.0" encoding="UTF-8"?>
<playlist version="1" xmlns="http://xspf.org/ns/0/">
  <title>Pink Floyd Playlist</title>
  <trackList>
    <track>
      <location>file:///music/SpeakToMe.mp3</location>
      <title>Speak to Me</title>
      <creator>Pink Floyd</creator>
      <album>The Dark Side of the Moon</album>
      <trackNum>1</trackNum>
    </track>
    <track>
      <location>file:///music/Breathe.mp3</location>
      <title>Breathe</title>
      <creator>Pink Floyd</creator>
      <album>The Dark Side of the Moon</album>
      <trackNum>2</trackNum>
    </track>
    ...
It’s not important to understand XML for these lessons – but, although you may never have written or viewed any XML before, you can likely make some sense of the playlist’s contents? Contained within an opening and closing pair of track tags (<track>...</track>), you can discern the details of each song. Without getting into the technical details, it’s relatively easy to parse this content using JavaScript so that it displays in a webpage (your blog).
Alternatively, you could elect to use JavaScript Object Notation. JSON files are named with a .json extension. The syntax closely resembles that of Python dictionaries:
{
  "playlist" : {
    "title"    : "Pink Floyd Playlist",
    "track"    : [
      {
        "location"    : ["file:///music/SpeakToMe.mp3"],
        "title"       : "Speak to Me",
        "creator"     : "Pink Floyd",
        "album"       : "The Dark Side of the Moon"
        "trackNum"    : "1"
      },
      {
        "location"    : ["file:///music/Breathe.mp3"],
        "title"       : "Breathe",
        "creator"     : "Pink Floyd",
        "album"       : "The Dark Side of the Moon"
        "trackNum"    : "2"
      },
      ...
XML and JSON are excellent formats for exchanging information between applications. Consequently, many programming languages (including Python) provide libraries for generating and parsing XML and JSON files.
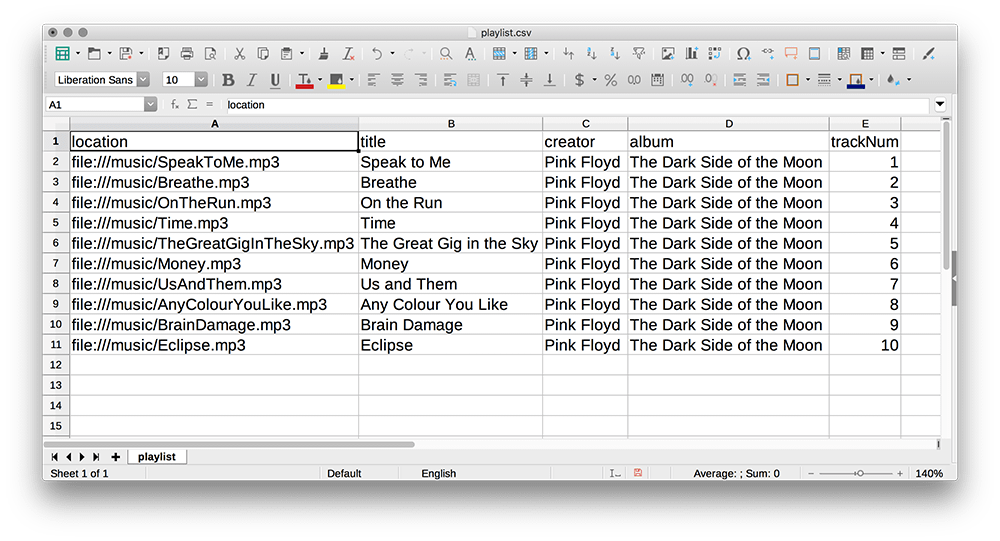
To keep things simple, we’ll look at reading in data from another text-type format: CSV. Comma-Separated Value files are, perhaps, the simplest means of formatting plain-text data. The file extension is – yup, you guessed it – .csv. Because of CSV’s simplicity, you can often forgo using a library. Each line of a CSV file is an entry. Each entry consists of one or more fields, separated by commas. Here’s the same abridged playlist in CSV format:
location,title,creator,album,trackNum
file:///music/SpeakToMe.mp3,Speak to Me,Pink Floyd,The Dark Side of the Moon,1
file:///music/Breathe.mp3,Breathe,Pink Floyd,The Dark Side of the Moon,2
...
The first line of the file contains the field headings. Lines two and three provide the details of tracks 1 and 2 respectively. You’ll find that your spreadsheet software (Microsoft Excel, LibreOffice Calc, or similar) will associate itself with any files bearing the extension .csv. Opening any CSV file in a spreadsheet displays the information in the typical row-and-column arrangement. This is useful for preparing CSV data – but be aware that none of the styling (cell-sizes, font colours, etc.) will be retained once saved back to CSV.
CSV files do not always rely on a comma to delimit each field. For instance, tab and space-separated values are standard, too.
To read in text-based files, Processing uses a loadStrings() function. If you want to experiment with the CSV code that follows, you can create a new “csv” sketch now. However, you may find that reading over the content is enough to grasp it. Then, you can begin coding again when you encounter the Game Sales Chart task.
As with all external assets, the playlist.csv must be placed in the “data” sub-directory of your sketch. The loadStrings() function accepts a single argument: the path of your text file. It returns this file as a list of strings, each representing an individual line.
csv = loadStrings('playlist.csv')
print(csv)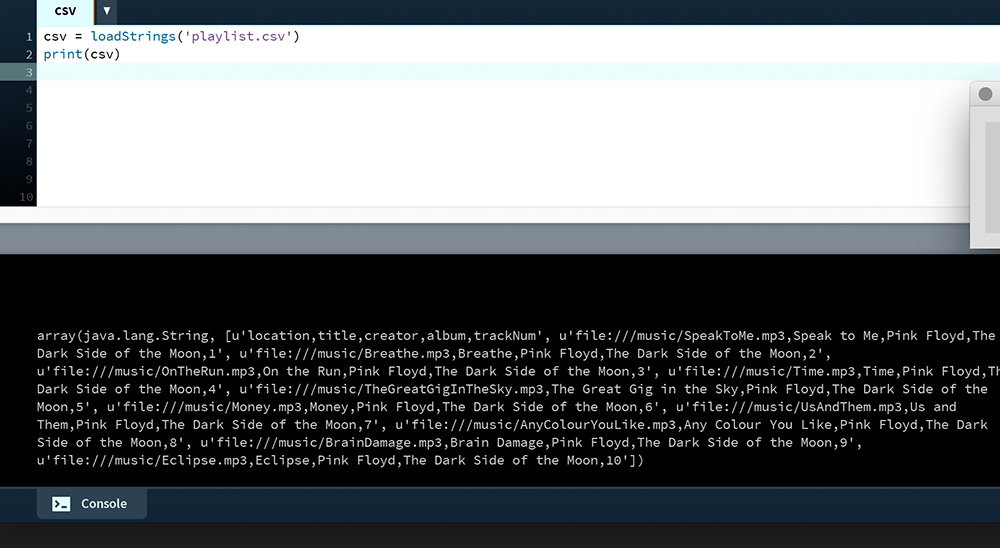
csv list printed to the Console.To separate out each line (the list’s elements) use a loop.
csv = loadStrings('playlist.csv')
#print(csv)

for entry in csv:
    print(entry)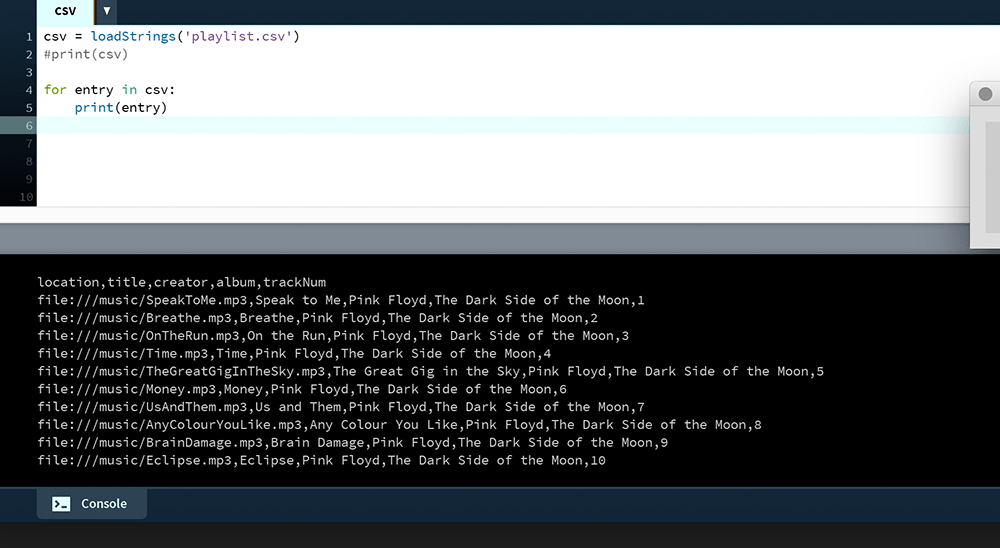
The split() method can now be used to dice up each line into further lists. This works using the delimiter argument of your preference – in this case, a comma.
csv = loadStrings('playlist.csv')
#print(csv)

for entry in csv:
    #print(entry)
    print( entry.split(',') )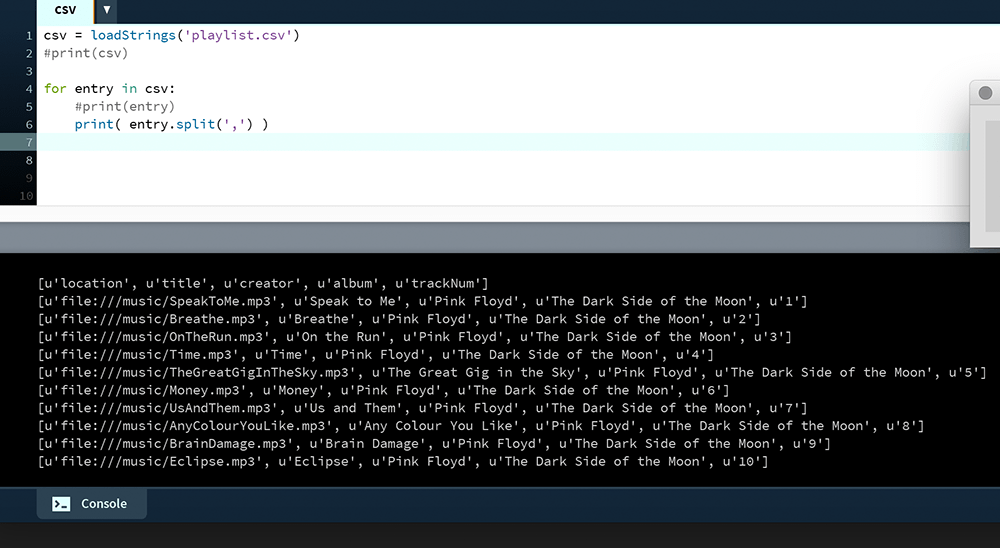
The u tags indicate unicode character representation. This is not important for now; unicode is effectively string data and everything will behave the same, regardless. To print the title of each track, retrieve the field with an index of [1].
csv = loadStrings('playlist.csv')
#print(csv)

for entry in csv:
    #print(entry)
    #print( entry.split(',') )
    print( entry.split(',')[1] )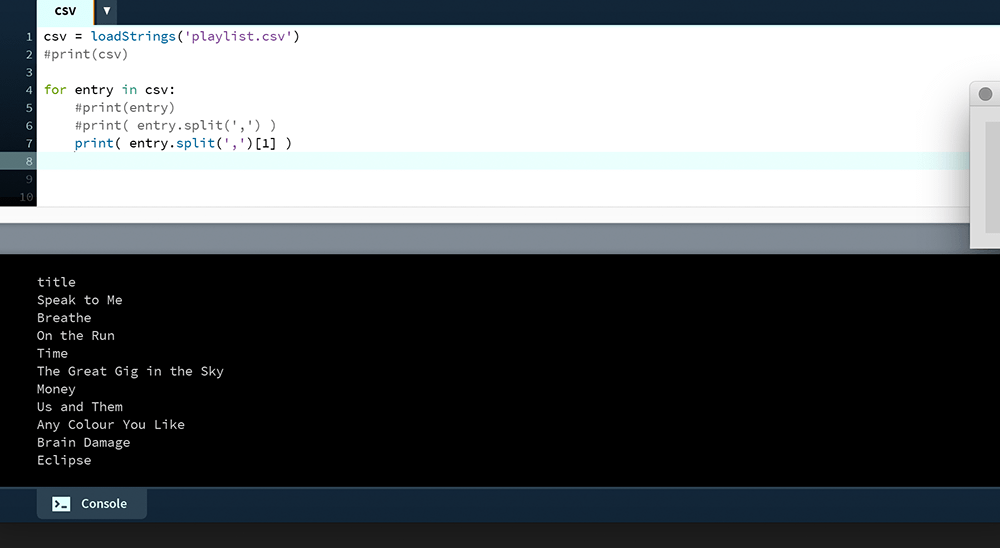
CSV, JSON, and XML each have their strengths and weaknesses. The beauty of CSV lies in its simplicity, but it does not support hierarchically-structured data. XML is an established, widely-supported, and flexible data exchange format, but it can turn out overly-complex and bloated at times. JSON is somewhat of a middle-ground, with a syntax that’s more compact than XML; JSON is also growing increasingly popular on the Web. You should weigh up the relative merits of each when considering what is best for your projects.
Game Sales Chart Task
In this final challenge, you’ll generate a bar chart of the best selling games of all time. Create a new sketch and save it as “game_sales_chart”.
The games list has been sourced from a Wikipedia article (which may well have shuffled since) and converted from an HTML table to a tab-delimited CSV file. Download a copy for your sketch and place it in the “data” sub-directory:
list_of_best-selling_video_games.csv
Add some basic setup code:
size(800,800)
background('#004477')
noStroke()
csv = loadStrings('list_of_best-selling_video_games.csv')
I have opted for tab-separated values. It’s highly unlikely that any game titles or studio/publisher names will contain tab characters, but there may be commas that could interfere with the split() step. Here are the first few lines of the of the CSV file; the tabs do not always form perfect columns, but, more importantly, there’s a single (invisible) tab character between each field.
Rank 	Sales 	Title 	Developer 	Publisher
1 	170000000 	Tetris 	Elektronorgtechnica 	Spectrum HoloByte
2 	144000000 	Minecraft  	Mojang 	Mojang
...
You may want to open the CSV file for yourself to inspect the values. There are fifty games in all. The respective sales figure will determine the width of each bar in your chart. You’ll need to perform some mathematical calculation to scale the bars relative to the display window – but, while the “Sales” figures appear to be numbers, they are actually stored as ‘text’. In other words, you cannot perform mathematical operations on string data. To demonstrate, add this code to the bottom of your sketch:
tetrisentry = csv[1].split('\t')
tetrissales = tetrisentry[1]
print( tetrissales )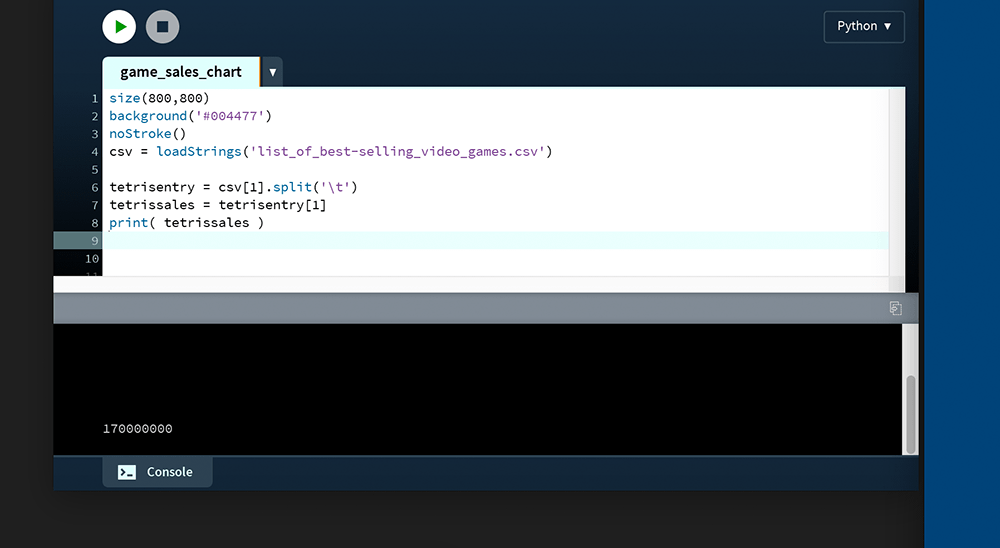
Okay, so everything seems fine, for now. You retrieved the Tetris sales figure and printed it to the Console. Next, try some arithmetic:
...
print( tetrissales + 1 )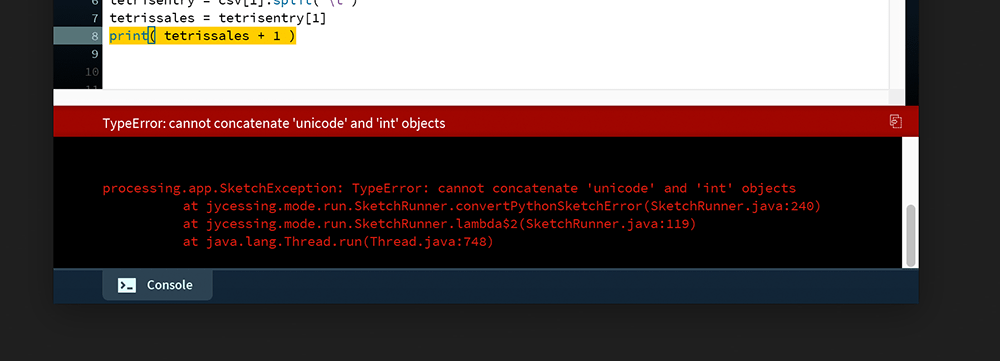
As reported in the Console, Python is unable to add together the unicode and integer data. Fortunately, there’s an easy fix. One must convert the unicode data to something numeric. The int() and float() functions convert various data types to integer and floating point values, respectively.
...
print( int(tetrissales) + 1 )
Run the sketch. The Console is now error-free and displays 170000001.
Now, complete the chart as per the screenshot below.
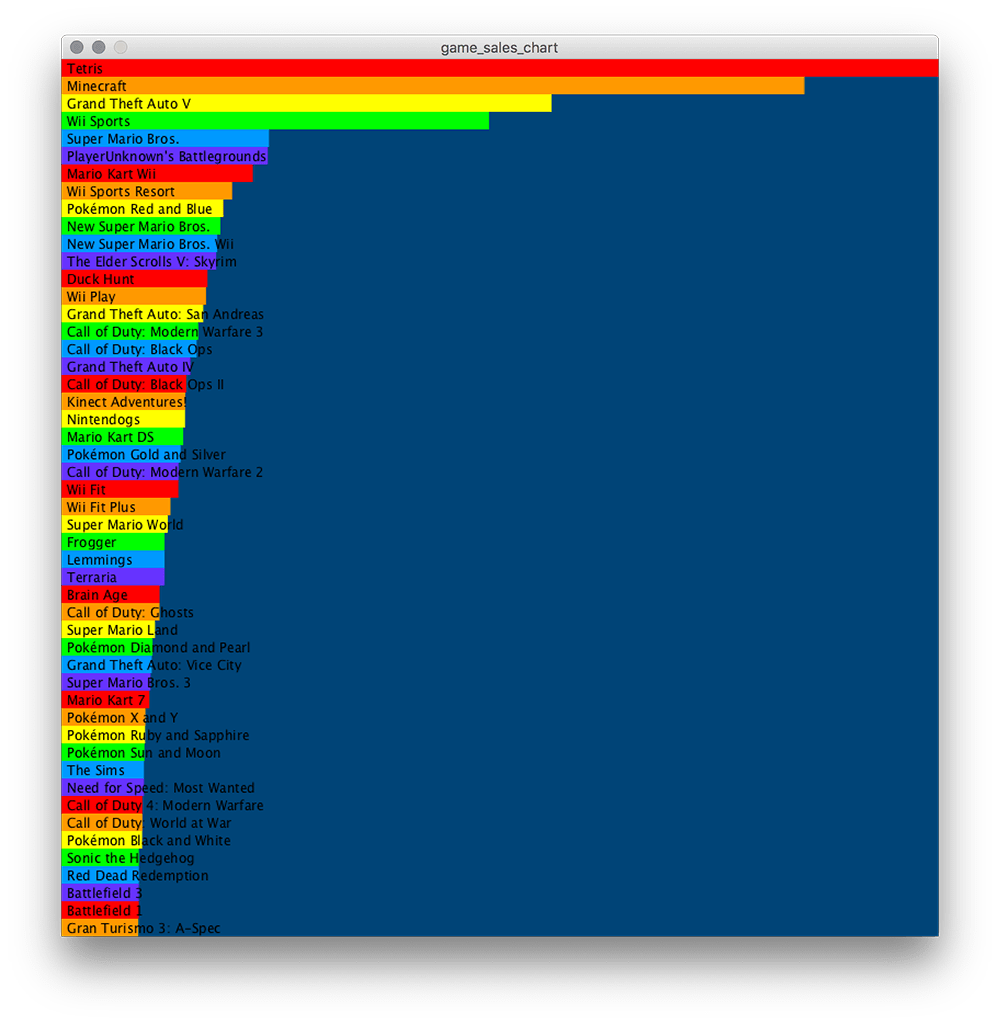
Begin with a loop that prints each entry. Then, get the labels displaying (before the bars). Once you’ve labels, add plain white bars of the correct width, then finish off with the rainbow sequence effect.
Lesson 6
That’s it for lesson 5! Lists and dictionaries are relatively straight-forward, though combining collections of values with loops is a trickier concept to grasp. That said, what you’ve learned here’s vital for what lies ahead – both in these lessons and beyond. In the next tutorial, we’ll zoom-in further, like, to pixel level. You’ll pick up some neat new skills, like how to read values off pixels to create your very own Photoshop-esque filters.
6.1: Image Formats »
Complete list of Processing.py lessons
References
- https://en.wikipedia.org/wiki/List_of_best-selling_video_games
- http://isabelmeirelles.com/book-design-for-information/
- http://lgames.sourceforge.net/
- https://py.processing.org/reference/
- https://towardsdatascience.com/the-art-of-effective-visualization-of-multi-dimensional-data-6c7202990c57
- https://www.python.org/dev/peps/pep-0020/