« 1.5: Arithmetic Operators |
2.1: Curves »
Disk Space Analyser Task
Here’s the final challenge before moving onto lesson 2. However, before tackling this one, you’ll need an introduction to drawing arcs.
The arc() function is used to draw elliptical arcs. It’s best to try out a few examples to see how it works. Create a new sketch and save it as “disk_space_analyser”. Add some code to get things started:
size(600,700)
background('#004477')
stroke('#FFFFFF')
strokeWeight(3)
noFill()
The arc() function takes the following arguments, expanded across multiple lines here for easier comprehension:
arc(
  x_coordinate, y_coordinate,
  width, height,
  start_angle, end_angle
)
Add an arc to your sketch using a start_angle of 0 and end_angle of 2
...
noFill()
arc(width/2,height/2, 200,200, 0,2)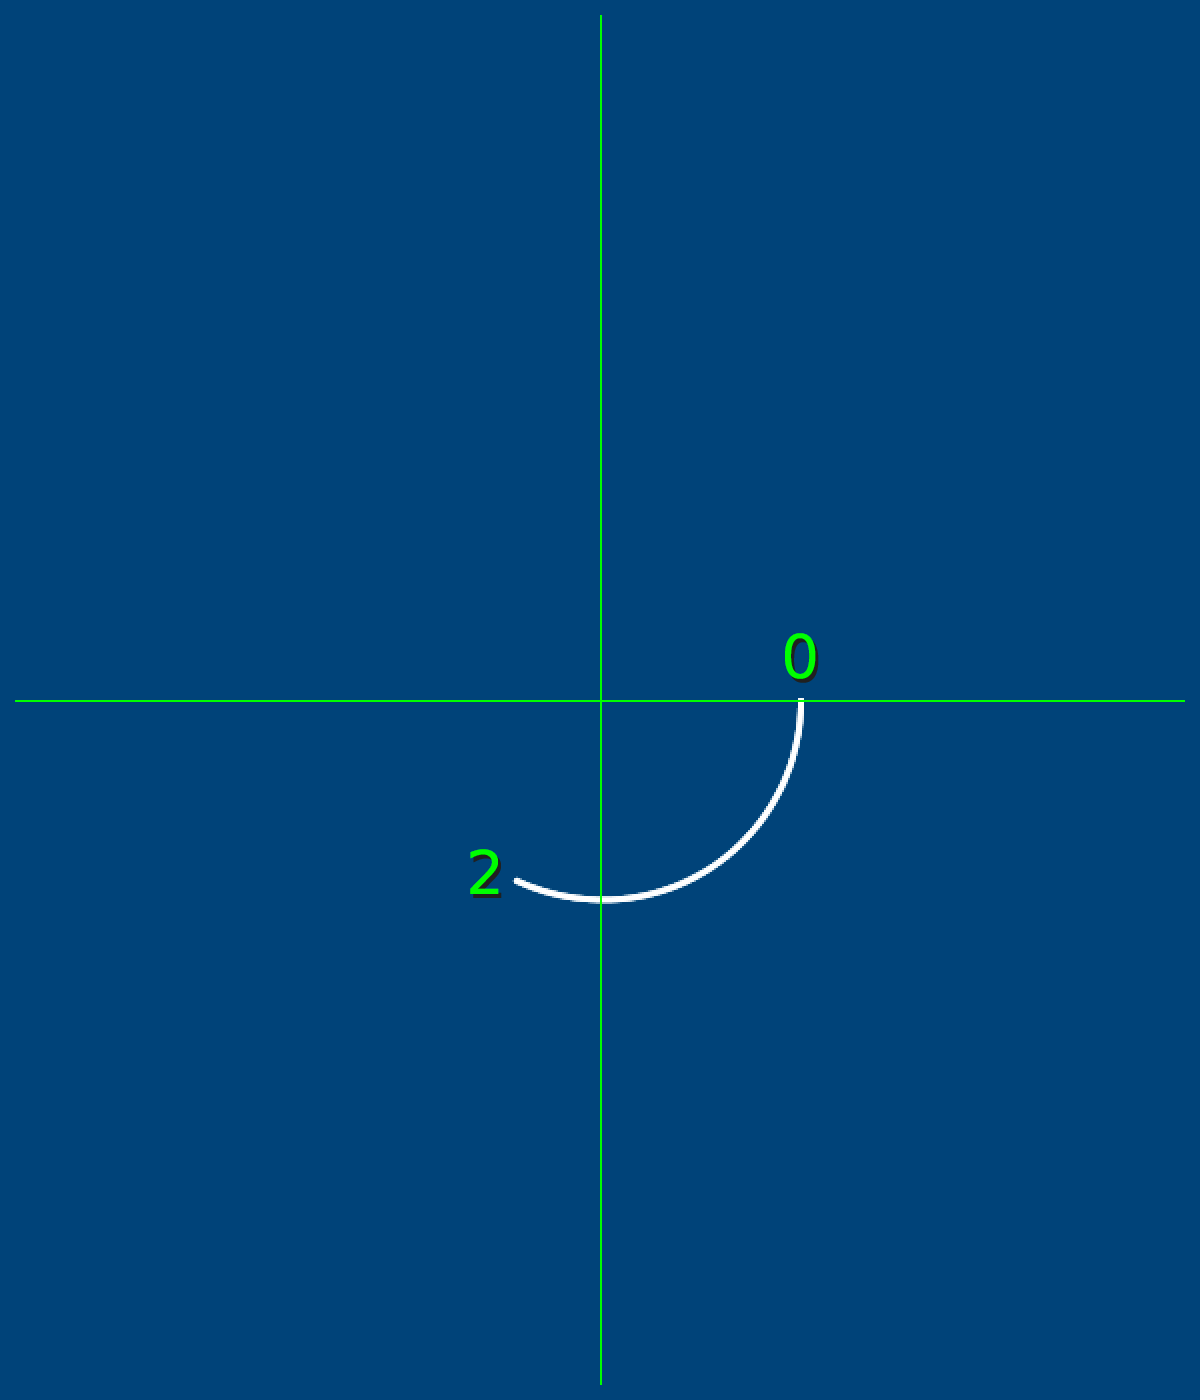
arc(width/2,height/2, 200,200, 0,2)The green overlay helps illustrate how things work. The arc is drawn along the perimeter of an invisible ellipse that’s centred on the given x/y coordinates. An angle of 0 is positioned at ‘East’, which then opens clockwise to an angle of 2 – which looks more like, around, 115 degrees of rotation? The reason for this is that Processing uses radians and not degrees. Why radians? Well, to answer a question with a question: why are there 360 degrees in a whole circle, anyhow? I mean, why not 500 or 100, or 1 million degrees? In fact, while we’re on the topic, why are there 60 minutes in an hour? Or 24 hours in a day? The answer has to do with influences from ancient civilisations and is beyond what you need to know for now. What you do need to know is that radians are a standard unit of angular measure used in many areas of mathematics. Rather than try to explain in writing how large/small a radian is, here’s a neat animation from Wikipedia:

Lucas V. Barbosa [Public domain], from Wikimedia Commons
There are plenty of online degree-to-radian converters out there, but it’s good to know a few key measurements. For starters, zero degrees is equal to zero radians, and 180 degrees is equal to approximately 3.142 radians. You recognise that number? Yep, it’s pi! Therefore, 360 degrees is equal to 2π. Add the following code:
...
noFill()
arc(width/2,height/2, 200,200, 0,2)
arc(width/2,height/2, 300,300, 0,PI)   # half-circle
arc(width/2,height/2, 400,400, 0,PI*2) # full-circle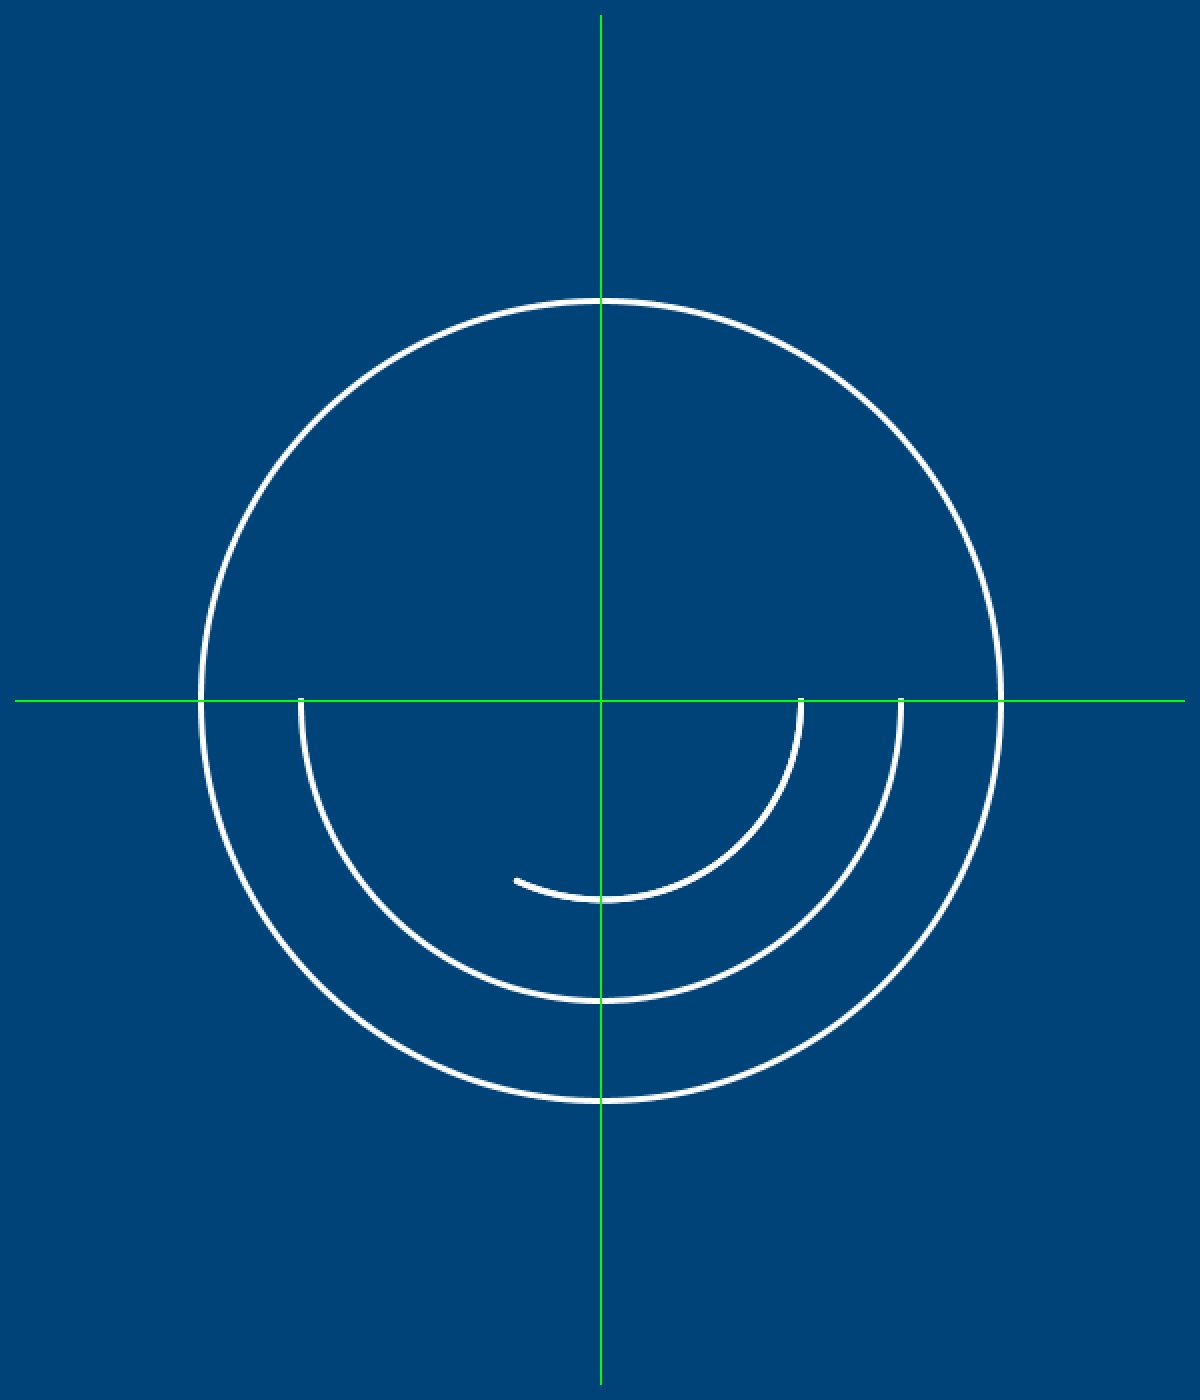
PI is a Processing variable representing π to 20 decimals places.To close an arc, so as to form a ‘slice’, add an additional PIE parameter:
...
noFill()
arc(width/2,height/2, 200,200, 0,2)
arc(width/2,height/2, 300,300, 0,PI)   # half-circle
arc(width/2,height/2, 400,400, 0,PI*2) # full-circle
arc(width/2,height/2, 350,350, 3.4,(PI*2)-(PI/2), PIE)
A disk usage analyser presents a graphical representation of what is on a disk drive. The Linux GNOME Disk Usage Analyzer is one example of such software. You’ll recreate the storage ring-chart below. The text and number labels have been added to assist you; you need not add them to your recreation.

Lesson 2
That’s it for lesson 1. I hope it was enjoyable, if somewhat challenging. Take a break – you deserve it! When you are ready to move on, proceed to lesson 2 using the link below. If you are familiar with vector graphics (Adobe Illustrator, Inkscape, etc.), you’ll be gaining some new insight into their inner-workings.
2.1: Curves »
Complete list of Processing.py lessons
References
- http://py.processing.org/reference/