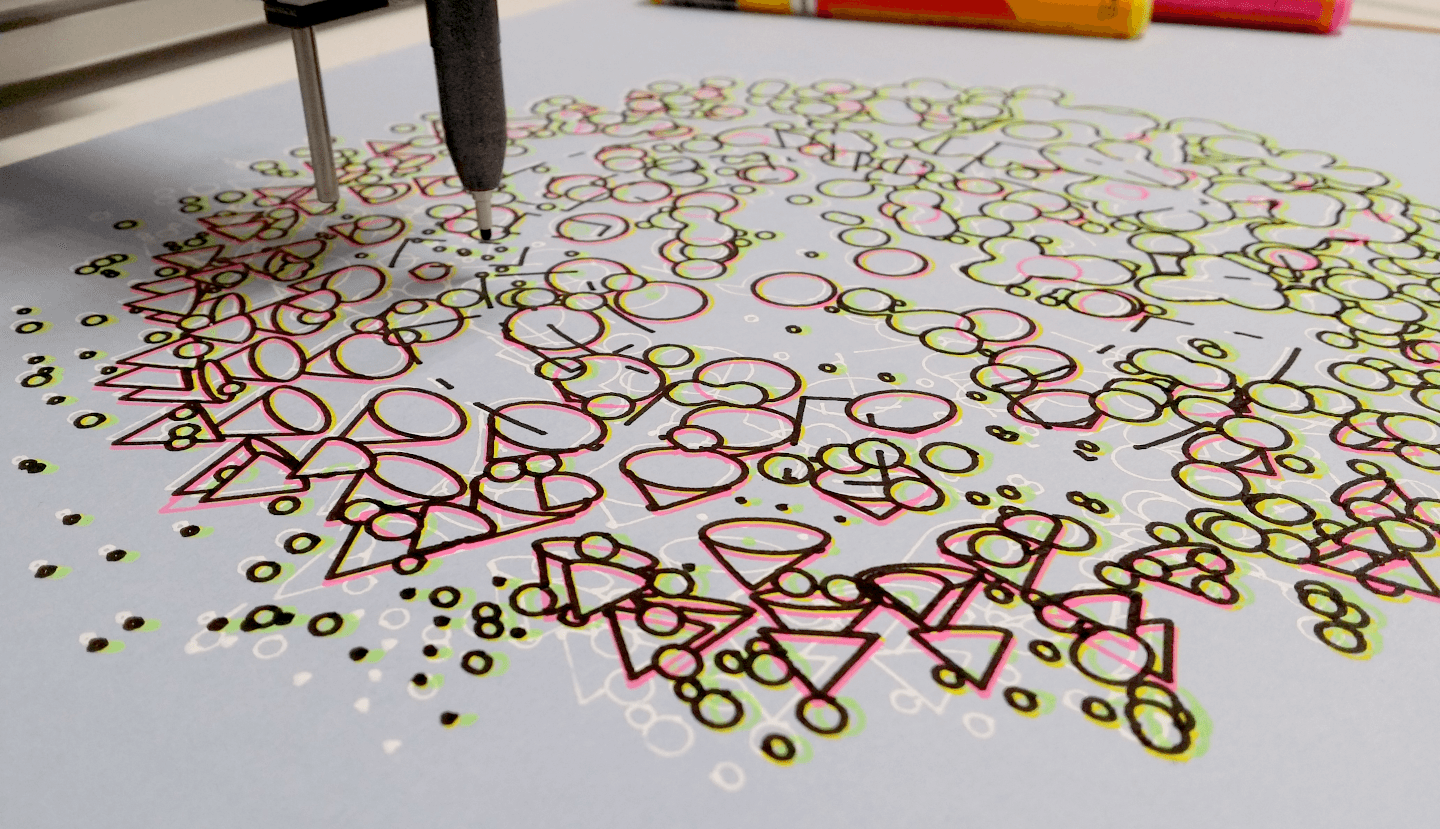
I recently acquired access to a pen plotter, which I’m excited to report makes a fantastic hardware addition to my growing suite of creative coding toys. Python has plenty to offer the plotter enthusiast – from powerful SVG optimisation tools like vpype to Blender scripting for ‘3D’ SVG renders, and more.

I’ve been working extensively with py5 for generative art projects and investigating it seriously as a tool for learning & teaching to code in a more visual context. I recently delivered a CC Fest presentation on my SVG+plotter adventures and discoveries using py5, the resources for which I’ve posted on GitHub –
https://github.com/tabreturn/cc-fest-plotter
Additionally, the presentation delves into some Blender techniques and even a few code-less generative SVG tools. The recording of the session covers three tasks – two I predicted I’d cover adequately and a third task I had to rush through. But, there are links to four tasks in all (a commented file for each).
Task 1: SVG concepts
In the first task (01-svg_concepts.svg), I cover some SVG essentials – that is, document structure and drawing a square and line using <rect> and <line> tags (Figure 1).
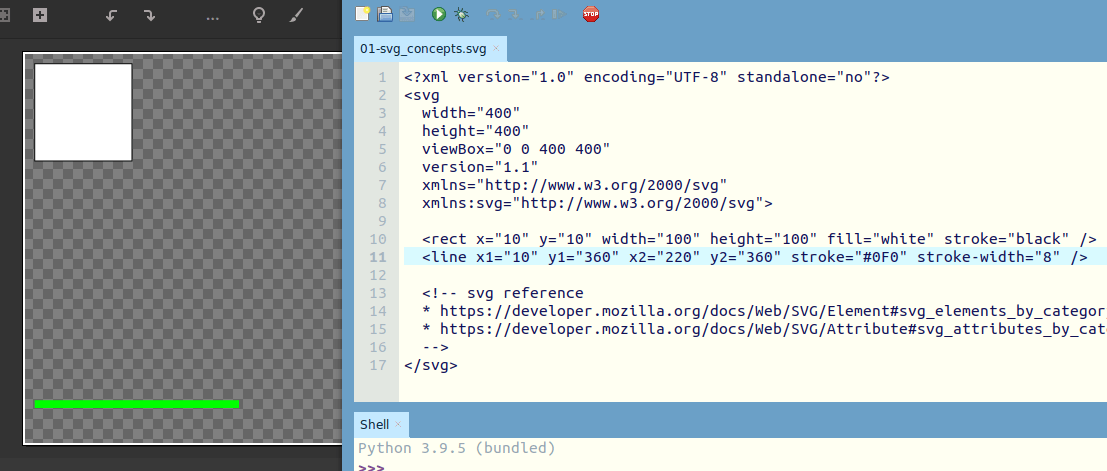
I don’t go into great detail about SVG, but once you get the gist of it – specifically, how the elements and attributes work – it’s relatively straightforward to find what you need using a decent SVG reference. I recommend the Mozilla developer docs:
- MDN’s SVG element reference
- MDN’s SVG attribute reference
This cursory introduction to SVG markup leads into generating SVGs with py5.
Task 2: py5 SVG
This is really the focus of the presentation – generating SVG files with py5 code for plotting art. I use the Thonny IDE for this section with the py5mode plug-in. The 02-py5_svg.py file steps through:
- creating an SVG file in py5 (and by extension, Processing);
- splitting different sections of a sketch into separate SVG files for multi-colour plots using different pens;
- combining those separate SVG files into a single, layered Inkscape file (and reviewing the attributes that control how Inkscape groups elements into layers);
- suppressing the py5/Processing display window, favouring hot-reloading of SVG files (in an image viewer) for preview purposes.
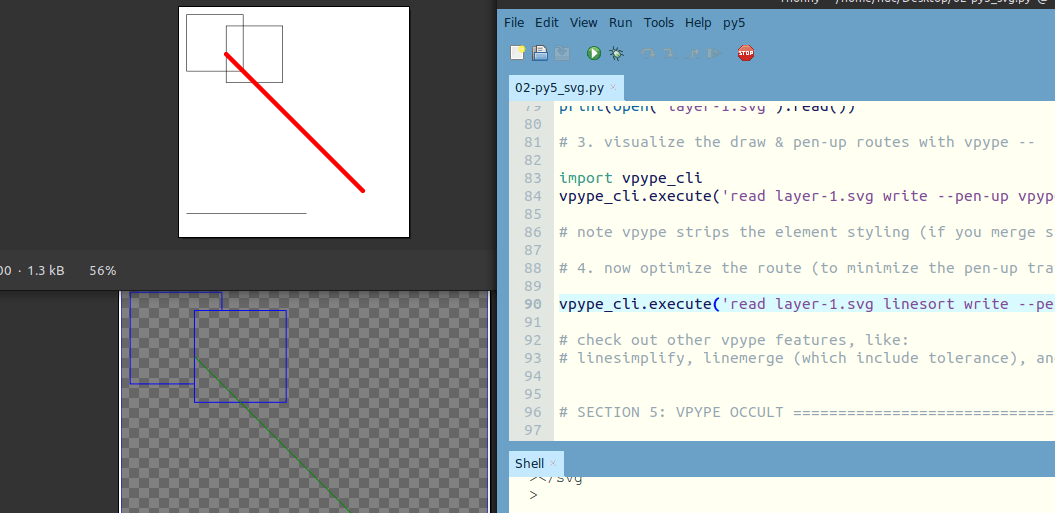
Then, I move into vpype (Figure 2) for:
- visualising the drawing routes the plotter must follow (where it will pick up the pen or lower it to draw);
- optimising the drawing route so that shapes and lines plot in the most efficient order;
- the occult plug-in for vpype to remove occulted lines (think: the lowermost shapes won't show through the ones overlapping them).
There’s far too much vpype awesomeness to cover in such a short time, and I point to some additional features (linesimplify, linemerge, multipass) and other plug-ins (for pixel art and hatching).
Task 3: Blender SVG
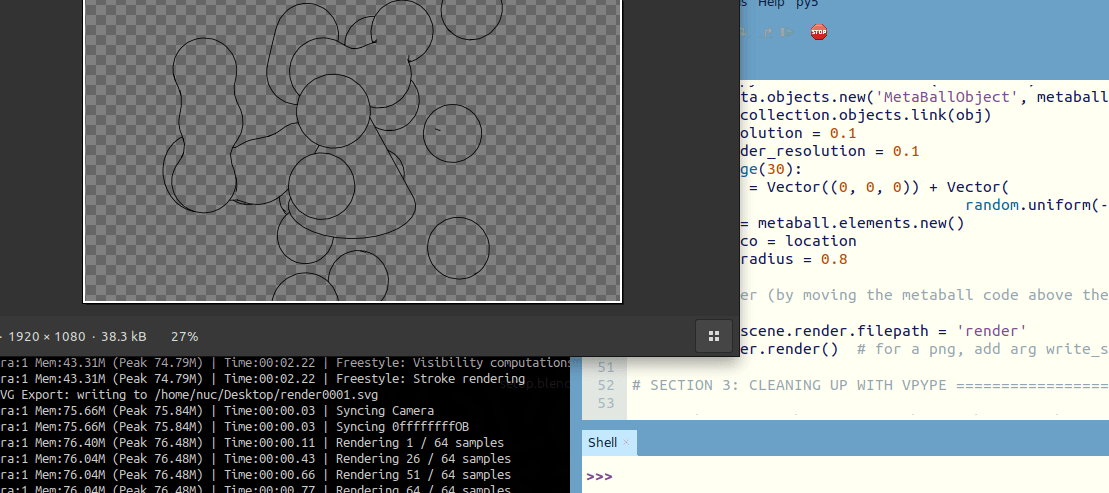
If you haven’t heard, Blender has a Python scripting API that makes for a powerful 3D creative coding environment. What’s more, the Blender Freestyle add-on enables SVG rendering/export capability. This means that you can write Blender code to render SVG artwork for plotting (Figure 3.1). There are many line options to play with – silhouette-style, wireframe-style, and so on.
The 03-blender_svg.py file task steps through:
- setting up an empty Blender scene to populate with code-generated 3D forms that will render as SVG outlines;
- writing Python code to generate a cone and some metaballs;
- running Blender ‘headless’ to render images straight from scripts (without opening Blender).
The fake-bpy-module is helpful to add Blender (bpy module) code-completion to your Python editor.
NOTE: you could also use Blender’s built-in code editor (“Scripting” workspace). I often prefer to write my code in a dedicated Python editor.
Once again, vpype will prove very useful for cleaning up and optimising your Blender-generated SVG files.
Task 4: Codeless SVG
(As initially anticipated) I don’t reach this far in my presentation session. The 04-codeless_svg.md file contains a set of steps (in markdown) for generating SVGs in the UJI web-app (Figure 4.1) and using Inkscape’s L-System feature (Figure 4.2).
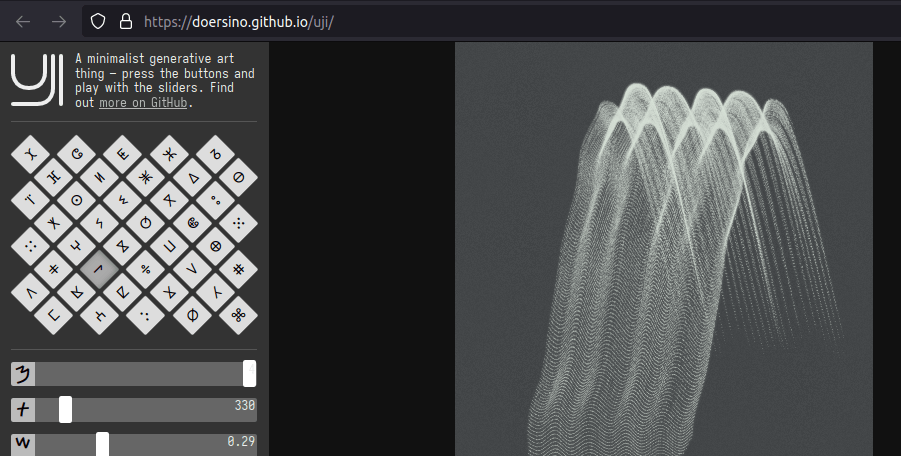
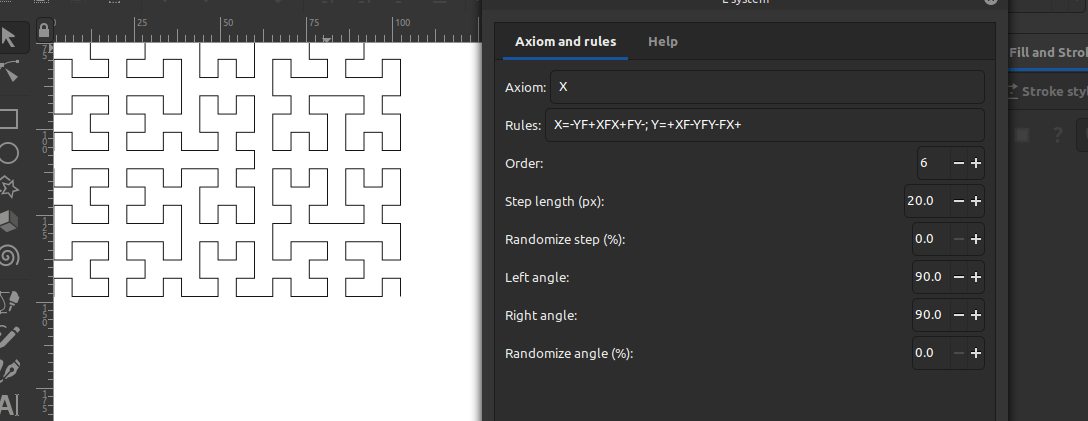
Yeah, I know – not exactly ‘Python’, but these make for some cool plotter artwork and are great fun for playing around. Also, if you get creative, you might combine/augment the results you generate with these tools using Python scripts …
In Closing
There was a big turnout for this Virtual edition of CC Fest, with a broad variety of sessions for attendees to join. It’s worthwhile tracking down the other talk recordings and accompanying materials. There’s always some Python representation at the events, and I’d encourage you to propose your own Python/Processing/etc. sessions. Reach out to me if you’d like some guidance and mentorship with this.
If you’re new to plotter art, I included some links to some inspiring artwork/artists.
End
References
- http://py5.ixora.io/
- https://doersino.github.io/uji/
- https://github.com/abey79/vsketch
- https://github.com/LoicGoulefert/occult
- https://github.com/tabreturn/thonny-py5mode